Tableau
The enterprise business intelligence standard — connect to any data source, build interactive dashboards, and ask Tableau Agent questions in plain English. Trusted by the Fortune 500.
Tableau Review: The Enterprise Data Visualization Platform That Has Earned Its Premium Positioning for Three Decades of Analytics Depth
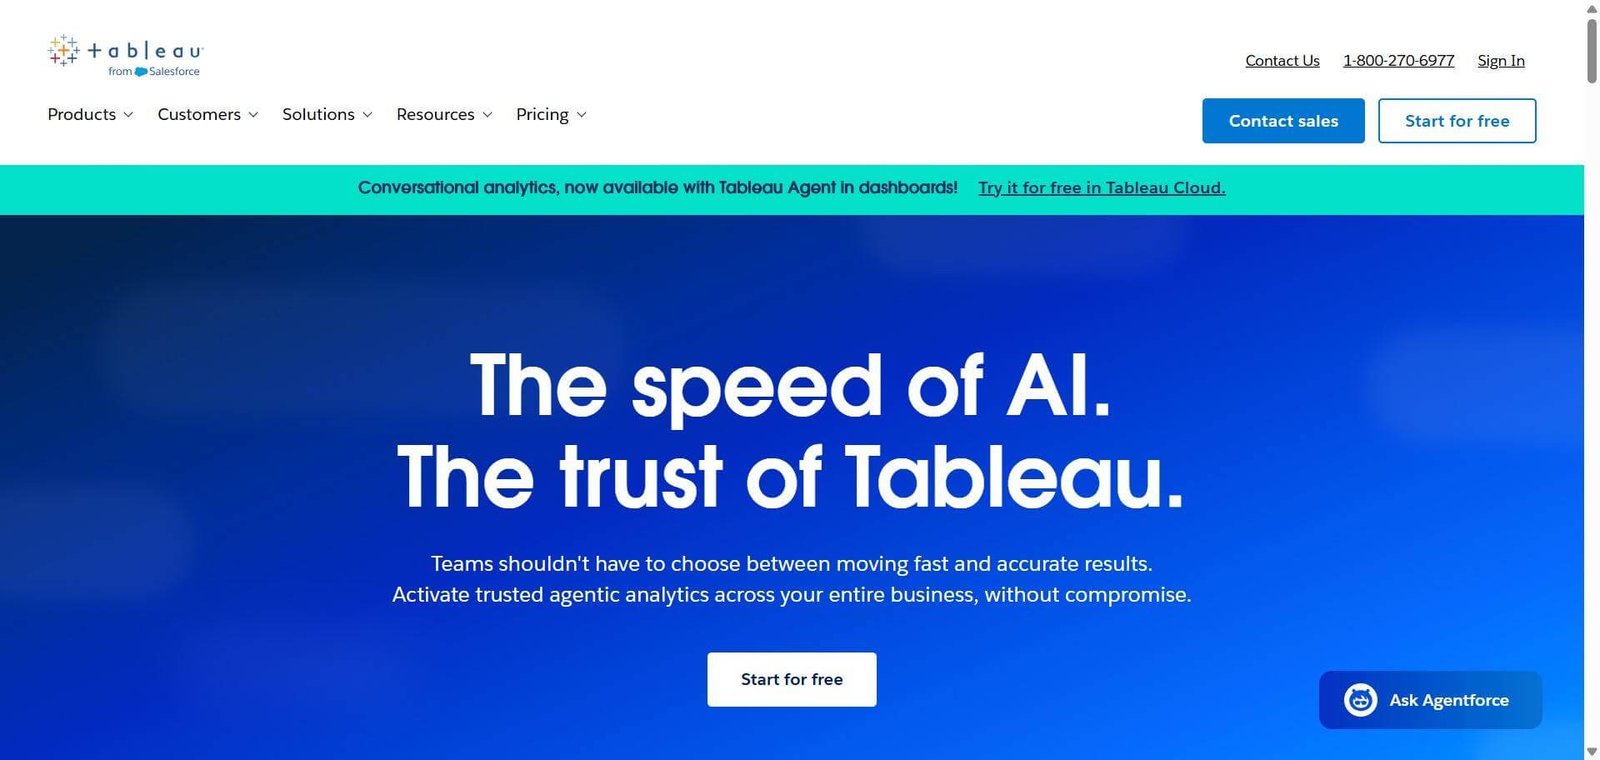
Enterprise business intelligence software has one fundamental tension: the most powerful analytics tools are typically the hardest to use, and the easiest tools sacrifice the depth that serious analysts need. Tableau was built to resolve this with its visual analytics model — a drag-and-drop interface that lets business analysts build sophisticated interactive dashboards without writing SQL or waiting for a data engineering team, while simultaneously offering the depth of calculated fields, LOD expressions, and live database connections that senior analysts and data teams require. Owned by Salesforce since 2019 and now deeply integrated with Salesforce Data Cloud, Agentforce, and the full Einstein AI ecosystem, Tableau in 2026 has added Tableau Agent for natural language analytics queries, Tableau Pulse for AI-proactive metric monitoring, and Tableau Next for agentic analytics workflows — building an AI layer on top of three decades of visualization depth that competitors cannot replicate overnight.
Quick Summary
Tableau is an enterprise data visualization and business intelligence platform owned by Salesforce, combining Tableau Desktop for data connection and visualization authoring, Tableau Cloud for managed SaaS deployment, Tableau Prep for data preparation, Tableau Pulse for AI-proactive metric monitoring, Tableau Agent for natural language analytics querying, and Tableau Next for agentic analytics workflows. Rated 4.4/5 on G2 from 2,196 reviews and 4.5/5 on Capterra from 2,397 reviews. Viewer license from $15/user/month, Explorer $42/user/month, Creator $75/user/month. Tableau Plus bundle with full AI suite available at custom pricing. Annual contracts required, no monthly billing.
Is it worth using? Yes for enterprise and mid-market data teams, business analysts, and analytics engineering teams who need the deepest visualization capabilities, live data connections to complex sources, and an AI layer grounded in Salesforce CRM and Data Cloud for organisations already in the Salesforce ecosystem.
Who should use it? Data analysts, BI managers, analytics engineers, and data-driven business teams at mid-market and enterprise organisations who need interactive dashboard publishing at scale, governed data access, and the deepest visualization flexibility in the market.
Who should avoid it? Small businesses and startups where Power BI at $14/user/month provides 80% of the visualization capability at a fraction of the cost. Also not ideal for non-Salesforce organisations evaluating the Tableau Plus AI bundle, where the AI premium is most valuable when grounded in Salesforce CRM data.
Verdict Summary
Best for
- Enterprise data teams and analytics engineers who need the deepest visualization flexibility in the market: hundreds of chart types, calculated fields, LOD expressions, set actions, and live database connections to complex data warehouses that lighter BI tools cannot match
- Salesforce ecosystem organisations who want AI analytics grounded in CRM, Service Cloud, and Data Cloud — Tableau Agent and Tableau Pulse integrate most powerfully with Salesforce-native data, making the AI bundle a natural extension for existing Salesforce Enterprise customers
- Large organisations with 50 plus dashboard consumers who want governed, role-secured analytics publishing at scale — Tableau Server and Tableau Cloud’s enterprise governance including row-level security, centralised data policies, and compliance controls are the most mature in the BI category
Not for
- Small businesses and cost-conscious startups where $75/user/month for Creator licenses is disproportionate to the analytics need. Power BI Pro at $14/user/month or Metabase at its open-source tier serve simpler analytics requirements at dramatically lower cost
- Non-technical business users who want self-service analytics without a learning curve. Tableau’s flexibility comes with complexity: most organisations need at least one trained Tableau Creator to build dashboards that others consume, and unguided self-service adoption rates are lower than marketing suggests
- Organisations that need to update source records from a dashboard. Like all BI platforms, Tableau is read-only for data visualisation — it does not write back to source systems
Rating
⭐⭐⭐⭐ 4.3 / 5
(G2: 4.4/5 from 2,196 reviews, Capterra: 4.5/5 from 2,397 reviews)
What Is Tableau?
Tableau was founded in 2003 by Chris Stolte, Pat Hanrahan, and Christian Chabot as a Stanford University research project, spinning out of work on the VizQL query language that underpins Tableau’s visual analytics model to this day. Salesforce acquired Tableau in 2019 for $15.7 billion — the largest acquisition in Salesforce’s history at the time — and has since integrated Tableau deeply with Salesforce Data Cloud, Agentforce, and the Einstein AI ecosystem.
The Tableau platform in 2026 consists of several interconnected products: Tableau Desktop for offline data exploration and viz authoring, Tableau Prep for visual data preparation and flow building, Tableau Cloud for managed SaaS deployment and dashboard publishing, Tableau Server for on-premises or private cloud deployment, and the AI layer of Tableau Pulse, Tableau Agent, and Tableau Next available through the Tableau Plus bundle.
How Tableau Works
- Connect to data sources. Tableau connects to 100 plus data sources natively — Snowflake, BigQuery, Redshift, Salesforce, Excel, Google Sheets, PostgreSQL, and dozens of others — through live connections that query the source in real time or extracts that cache data for performance. No ETL pipeline required for most common sources.
- Build visualisations with drag and drop. Drag dimensions and measures onto the Tableau canvas to build charts, maps, and tables. The VizQL engine translates visual operations into database queries automatically, allowing analysts to explore data without writing SQL. Calculated fields, LOD expressions, and table calculations add analytical depth beyond drag-and-drop basics.
- Assemble dashboards with interactive elements. Combine multiple visualisations into interactive dashboards with filters, parameters, actions, and drill-throughs. Dashboard actions allow one chart to filter another — clicking a bar in a regional sales chart filters every other viz on the dashboard to that region automatically.
- Publish to Tableau Cloud or Server. Publish completed dashboards to Tableau Cloud for governed, role-secured access. Viewer licenses allow stakeholders to consume and interact with dashboards without authoring access. Row-level security restricts data visibility per user without building separate dashboards.
- Ask Tableau Agent questions in plain English. On the Tableau Plus bundle, Tableau Agent accepts natural language queries — “which region had the highest revenue growth last quarter compared to the same period last year?” — and generates the answer as a visualisation or written insight without requiring the user to build the chart manually.
- Monitor metrics with Tableau Pulse. Tableau Pulse monitors key metrics continuously and proactively sends AI-generated insight digests — “your customer acquisition cost increased 18% this week, primarily driven by paid social spend in the APAC region” — to stakeholders via Slack, email, or the Salesforce platform without waiting for a scheduled report.
Key Features
- 100 plus native data connectors: Snowflake, BigQuery, Redshift, Salesforce, Excel, Google Sheets, and others
- VizQL visual analytics engine: drag-and-drop chart building that generates database queries automatically
- Calculated fields, LOD expressions, and set actions for advanced analytical depth
- Interactive dashboards with filter actions, parameters, and drill-through navigation
- Tableau Prep: visual data preparation and flow building with no-code transformations
- Tableau Pulse: AI-proactive metric monitoring delivering insight digests to Slack, email, and Salesforce
- Tableau Agent: natural language analytics queries generating visualisations and written insights
- Tableau Next: agentic analytics workflows for autonomous multi-step analysis
- Row-level security for governed, role-secured data access without separate dashboards
- Tableau Cloud: fully managed SaaS deployment with automatic updates
- Tableau Server: on-premises or private cloud deployment for data residency requirements
- Salesforce Data Cloud and Agentforce integration for CRM-grounded AI analytics
- Embedded Analytics for ISVs building analytics into third-party products
- Rated 4.4/5 on G2 from 2,196 reviews, 4.5/5 on Capterra from 2,397 reviews
- Trusted by the majority of the Fortune 500
Real-World Use Cases
- Executive dashboard for a retail chain: A 500-store retail chain’s analytics team builds a regional sales performance dashboard in Tableau connected live to Snowflake. Regional managers log into Tableau Cloud and see their region’s data automatically filtered by row-level security. The dashboard shows year-over-year revenue, basket size, foot traffic, and inventory turns in one interactive view. Tableau Pulse sends a Monday morning digest to every regional manager highlighting the week’s key metric movements without the analytics team preparing a separate weekly report.
- Natural language analytics for a finance team: A CFO uses Tableau Agent to ask “show me the three business units with the largest variance between Q2 budget and Q2 actuals” and receives a ranked bar chart with variance percentages in 15 seconds without opening Tableau Desktop or asking the analytics team to build a new report. The answer is grounded in the company’s financial data already in Tableau Cloud.
- Marketing attribution dashboard: A marketing analytics team connects Tableau to Salesforce CRM, Google Ads, Meta Ads, and Salesforce Data Cloud. The attribution dashboard shows the full customer journey from first ad impression to closed deal, with Tableau’s multi-source join capability combining data from all four sources into one unified view. Tableau Pulse alerts the demand generation manager when cost-per-lead for a specific campaign exceeds the threshold defined in the metric configuration.
- Embedded analytics for a SaaS product: A B2B SaaS company embeds Tableau dashboards into their product’s analytics module using Tableau Embedded Analytics. Customers see their own usage data in professionally designed, interactive dashboards without the SaaS company building a custom analytics layer from scratch. The embedded dashboards inherit Tableau’s full visualization depth and row-level security ensures each customer sees only their own data.
Pros and Cons
| Pros | Cons |
|---|---|
| 4.4/5 G2 from 2,196 reviews and 4.5/5 Capterra from 2,397 reviews. The most validated enterprise BI platform by independent review volume and consistently strong satisfaction scores across analyst and business user audiences | Creator license at $75/user/month is 5x the cost of Power BI Pro at $14/user/month. The cost difference is significant for budget-conscious organisations where Power BI’s capabilities are sufficient |
| 100 plus native data connectors with live query support. The broadest out-of-the-box data connectivity in the BI category without requiring custom ETL pipelines for most common enterprise data sources | Annual contracts required with no monthly billing option. Single-year contracts run 20 to 30% more than multi-year deals, and the minimum Creator license at $900/year creates a commitment floor before any deployment begins |
| Tableau Pulse and Tableau Agent add AI-proactive monitoring and natural language querying on top of the deepest visualization platform in the market. Most competitors have AI on lighter visualization platforms | Tableau Plus AI bundle requires a custom sales conversation. Teams evaluating the AI capabilities cannot self-serve on pricing or trial the Agent and Next features without engaging the Salesforce enterprise sales process |
| Salesforce Data Cloud and Agentforce integration creates the most AI-capable BI platform for Salesforce ecosystem organisations. AI analytics grounded in CRM, service, and marketing data is the most compelling use case for the Tableau Plus bundle | Training costs of $1,500 to $3,000 per Creator and the platform’s learning curve mean Creator licenses are often underutilised without investment in enablement. Raw license cost understates total cost of ownership |
| Row-level security, centralised data policies, and enterprise governance on Tableau Cloud and Server. The most mature governance layer in the BI category for large organisations with compliance requirements | 60 to 80% of BI dashboards go unused after the first month in independent research. Tableau’s depth can produce over-engineered dashboards that stakeholders do not interact with. Adoption enablement requires active management beyond deployment |
Pricing & Plans
Tableau Cloud — Per-user annual licensing
| License Type | Price | Access Level |
|---|---|---|
| Viewer | $15/user/month | View and interact with published dashboards only |
| Explorer | $42/user/month | Web-based editing of existing workbooks and creation of new visualisations from published data sources |
| Creator | $75/user/month | Full platform access: Tableau Desktop, Tableau Prep, publishing to Tableau Cloud |
- Minimum one Creator license required per deployment
- Annual contracts only — no monthly billing
- Single-year contracts run 20 to 30% above multi-year rates
- Volume discounts begin at approximately 50 users, steepen at 250 users
Tableau Standard — $75/user/month (Creator equivalent)
- Core exploration and analytics
- Tableau Desktop and Prep
- Tableau Cloud access
Tableau Enterprise — $115/user/month
- All Standard features
- Advanced data management and governance
- Advanced Management for server administration
- Data lineage and cataloguing
- Viewer license upgrades to $35/user/month
Tableau Plus — Custom pricing (requires sales conversation)
- All Enterprise features
- Tableau Next
- Tableau Agent for natural language analytics
- Agentforce analytics integration
- Pulse premium features
- Salesforce Data Cloud integration
- Release Preview access
Negotiation levers confirmed by independent research:
- Volume discounts: start at 50 users, steepen at 250
- Multi-year commitment: additional 5 to 12% versus annual
- Competitive pressure: documented Power BI or Looker proposal in file accelerates concessions up to 30% without escalation
Training costs: $1,500 to $3,000 per Creator for structured training. Total cost of ownership exceeds licence cost significantly for large deployments. Contact tableau.com for current pricing.
Best Alternatives & Comparisons
- Power BI — Better for Microsoft 365 organisations wanting enterprise BI at $14/user/month Pro with Copilot AI add-on at $30/user/month — 5x cheaper than Tableau Creator for comparable workloads in Microsoft-centric environments
- Looker — Better for organisations that want semantic layer-first BI with code-defined data models (LookML) and native Google Cloud and BigQuery integration
- Domo — Better for business users who want self-service BI with a lower learning curve and built-in data pipeline capabilities without requiring a separate data engineering layer
- Metabase — Better for small and mid-market teams wanting open-source or affordable BI at $500/month flat for up to 5 users without per-seat cost scaling
Frequently Asked Questions (FAQ)
Tableau is an enterprise data visualization and business intelligence platform owned by Salesforce, combining drag-and-drop dashboard authoring, 100 plus data connectors, Tableau Pulse for AI-proactive metric monitoring, and Tableau Agent for natural language analytics queries. Rated 4.4/5 on G2 from 2,196 reviews. Viewer from $15/user/month, Creator from $75/user/month.
Tableau does not offer a permanent free plan. Tableau Public is a free version for non-confidential public data visualisation without data privacy controls. Tableau Desktop has a 14-day free trial. Paid plans start at $15/user/month for Viewer access and $75/user/month for Creator licenses on annual billing.
Tableau Agent is Tableau’s natural language analytics feature in the Tableau Plus bundle, allowing users to ask questions about their data in plain English and receive AI-generated visualisations or written insights in response. It is available exclusively through the Tableau Plus bundle, which requires a custom sales conversation for pricing.
Tableau Pulse is an AI-proactive metric monitoring feature that continuously tracks key business metrics and delivers AI-generated insight digests to stakeholders via Slack, email, and the Salesforce platform. Rather than waiting for a stakeholder to open a dashboard, Pulse proactively surfaces significant metric movements and their likely drivers.
Tableau Viewer is $15/user/month, Explorer $42/user/month, and Creator $75/user/month, all on annual contracts with no monthly billing. Tableau Enterprise is $115/user/month for Creators. Tableau Plus with the full AI suite requires a custom quote. Single-year contracts run 20 to 30% above multi-year rates. Volume discounts apply from 50 users onward.
Tableau has deeper visualization flexibility, more mature enterprise governance, and a broader data connector library. Power BI is 5x cheaper for Creator-equivalent access at $14/user/month Pro, natively integrated with Microsoft 365 and Azure, and sufficient for most mid-market analytics needs. Tableau for organisations requiring the deepest visualization depth and mature enterprise governance. Power BI for Microsoft-ecosystem organisations where cost efficiency is the primary decision driver.
Final Recommendation
Tableau is the most visualization-capable and most governed enterprise BI platform available, and its combination of three decades of visualization depth, 100 plus native data connectors, and the 2026 AI additions of Tableau Agent, Tableau Pulse, and Tableau Next create the most analytically comprehensive platform in the market for organisations whose data complexity justifies the investment. The $75/user/month Creator cost and annual contract requirement are genuine barriers that make Tableau the wrong choice for small teams and organisations where Power BI covers the need at a fraction of the cost. For enterprise data teams and analytics engineers who have hit the ceiling of lighter BI tools and need the full depth of Tableau’s visualization engine with AI-proactive monitoring grounded in Salesforce data, Tableau earns its premium positioning with capabilities that no cheaper alternative currently replicates at equivalent scale.
Next steps