itirupati.com AI Tools

Polymer

Upload your spreadsheet — AI automatically builds your dashboard, finds patterns, and answers your questions.

Polymer Review: The AI Data Platform That Makes Spreadsheet Analysis Genuinely Self-Serve

Business intelligence tools have a skill gap — the people who have the data questions are rarely the same people who know how to build dashboards. Polymer closes this gap by taking spreadsheet data and automatically generating a smart interactive interface — with AI that creates visualisations, finds connections, and answers questions about the data in plain language. The result is a BI tool that analysts can deploy and non-technical stakeholders can actually use without SQL, pivot tables, or Tableau training.

Quick Summary

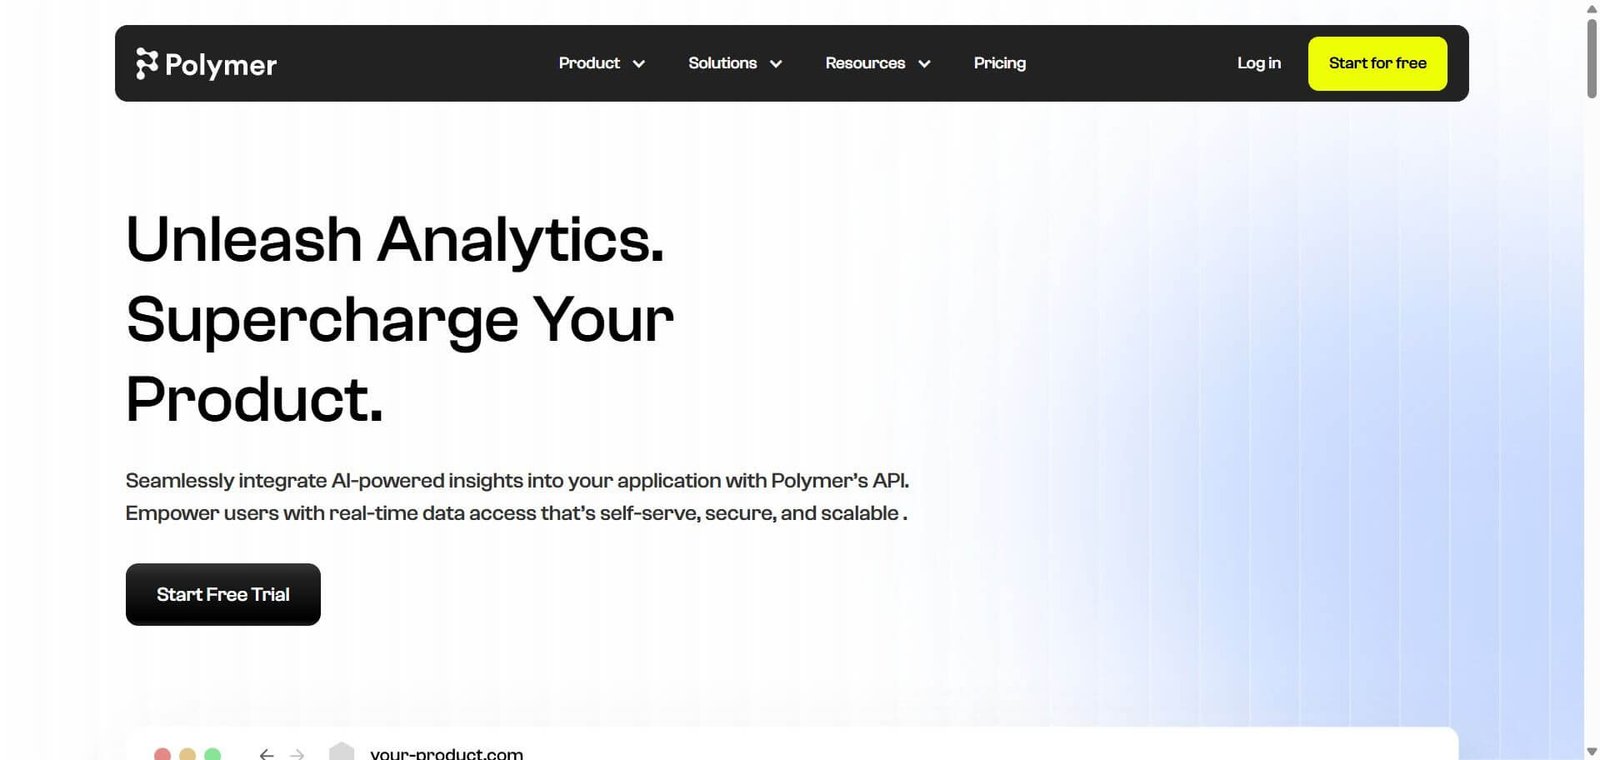
Polymer is an AI-driven analytics platform that provides easy-to-implement APIs allowing teams to bring sophisticated reporting, data-driven intelligence, and actionable insights directly into their products. What sets Polymer apart is its focus on user retention and satisfaction, with AI-assisted data storytelling, pre-built reports, and customisable access.

Is it worth using? Yes for marketers, operations teams, and SaaS founders who want AI to handle the data analysis layer — generating visualisations and answering questions from spreadsheet data without requiring SQL or BI expertise.
Who should use it? Marketers, operations managers, SaaS founders, and business analysts who need data insights from spreadsheets without the complexity of traditional BI tools or the SQL knowledge required for data warehouse queries.
Who should avoid it? Data teams who need enterprise-grade data warehousing, complex SQL queries across multiple databases, or the full feature depth of Tableau and Looker.

Verdict Summary

Best for

  • Marketing teams who want to turn their campaign performance CSVs into interactive dashboards without asking a data analyst — Polymer generates the visualisations automatically and lets team members query the data conversationally
  • SaaS founders and product teams who want to embed analytics dashboards into their product for customer-facing data — Polymer’s API starts at $500/month with flexible plans tailored to data volume and user access needs 
  • Operations managers who work with regular spreadsheet exports and want AI to surface trends, exceptions, and insights without building pivot tables manually each time

Not for

  • Data engineering teams who need complex SQL joins across multiple enterprise data warehouse tables
  • Organisations whose BI needs require the full governance, access control, and modelling layer of Tableau or Looker
  • Teams whose data lives primarily in structured databases rather than spreadsheets and flat files

Rating
⭐⭐⭐⭐ 4.2 / 5

What Is Polymer?

Polymer is an AI-driven analytics platform that seamlessly integrates into applications via API, enabling businesses to embed powerful analytics, AI-assisted data storytelling, and pre-built reports directly into their products.

At its core, Polymer’s AI automatically creates a smart interface from spreadsheet data — enabling users to ask complex questions, discover valuable connections, and become their own data expert in seconds. The platform serves two primary use cases: self-serve analytics for business teams working with their own data, and embedded analytics for SaaS companies building customer-facing data features.

How Polymer Works

  • Upload your data. Connect a Google Sheet, upload a CSV, or connect a data source. Polymer reads the structure and content of the data immediately.
  • AI builds the dashboard. Polymer’s AI automatically creates a smart interface from your spreadsheet data — generating relevant charts, summary statistics, and visualisations without configuration.
  • Ask questions in plain language. Query the data conversationally — “what were the top 5 products by revenue last month?” or “show me conversion rate trends by traffic source” — and receive accurate chart and table responses.
  • Discover AI-surfaced insights. Polymer’s AI proactively identifies patterns, anomalies, and connections in the data that manual analysis might miss — surfacing findings without requiring the user to know what questions to ask.
  • Share and embed. Share dashboards with team members or stakeholders via link, or embed analytics into a product using Polymer’s API — customise the interface to match the brand’s look and feel including fonts, colours, and logos. 
  • Keep data updated. Connect live Google Sheets for automatic dashboard updates as the source data changes — dashboards reflect current data without manual refresh.

Key Features

  • AI automatic dashboard generation from uploaded spreadsheet and CSV data
  • Natural language querying — ask data questions in plain English
  • AI-assisted data storytelling and pre-built reports for actionable insights
  • Proactive AI insight surfacing — patterns and anomalies identified without prompting
  • Embedded analytics API for SaaS product integration — fully customisable interface to match brand styling
  • Google Sheets live connection for auto-updating dashboards
  • Shareable dashboard links for stakeholder access without Polymer accounts
  • Free plan available — Starter plan at $10/month billed annually, paid plans up to $250/month
  • Data storytelling features for communicating insights to non-technical audiences

Real-World Use Cases

  • Marketing campaign analysis: A marketing manager uploads their monthly campaign performance CSV to Polymer — the AI generates a dashboard covering channel performance, conversion rates, and cost trends automatically. They ask “which campaign had the highest ROAS?” in plain language and receive the answer with a supporting chart in seconds.
  • Sales pipeline reporting: A sales operations manager creates a live Polymer dashboard connected to their Google Sheet CRM export — the team checks pipeline health, stage conversion rates, and rep performance from an auto-updating dashboard without waiting for a weekly report.
  • SaaS product analytics: A SaaS company embeds Polymer’s analytics API into their product — customers see their own usage data in a branded dashboard that Polymer generates automatically from the product’s data exports, adding significant value to the product without months of engineering investment.
  • E-commerce inventory analysis: An e-commerce operations manager uploads their inventory and sales data to Polymer — the AI surfaces slow-moving SKUs, identifies seasonal patterns in product categories, and flags reorder timing opportunities that would take hours to find in a spreadsheet.

Pros and Cons

ProsCons
AI automatic dashboard generation removes the BI setup barrier for non-technical usersLess suitable for complex SQL queries across enterprise data warehouses
Natural language querying makes data accessible to every team member regardless of technical backgroundEmbedded analytics API starts at $500/month — significant investment for early-stage SaaS teams
Focus on user retention and satisfaction with AI storytelling and pre-built reports for actionable insights Data accuracy verification still recommended before sharing with stakeholders
Free plan available for individual evaluation — no credit card requiredLess governance, access control, and modelling depth than enterprise BI platforms
Embedded API enables customer-facing analytics without engineering investmentLarge and complex datasets may have processing time delays

Pricing & Plans

Free — $0/month
  • Core AI dashboard generation
  • Limited datasets
  • Basic visualisations
  • Community support
Starter — $10/month (billed annually)
  • More datasets and rows
  • Full AI querying
  • Shareable dashboards
  • Priority support
Growth and higher — Up to $250/month
  • Larger data volumes
  • Team access
  • Advanced features
  • Priority support
Embedded Analytics API — From $500/month
  • API access for integrating analytics into SaaS products — flexible plans tailored to data volume and user access needs
  • Full brand customisation
  • Dedicated support

Best Alternatives & Comparisons

  • Julius AI — Better for conversational data analysis from uploaded files with statistical depth
  • Rows AI — Better for spreadsheet-native AI analysis within a spreadsheet interface
  • Tableau — Better for enterprise BI with complex data modelling, SQL, and governance
  • Looker — Better for enterprise data warehouse analytics with LookML modelling

Frequently Asked Questions (FAQ)

What is Polymer?

Polymer is an AI-driven analytics platform that automatically creates a smart interface from spreadsheet data — enabling users to ask complex questions, discover valuable connections, and get data insights in seconds without SQL or BI expertise.

Is Polymer free?

Yes — Polymer offers a free plan. Starter plan starts at $10/month billed annually. Paid plans go up to $250/month for higher data volumes and team access.

Can Polymer connect to live Google Sheets?

Yes — Polymer connects to Google Sheets for live data dashboards that update automatically as the source sheet changes, without manual re-upload or refresh.

What is Polymer's embedded analytics API?

Polymer’s API allows SaaS companies to embed analytics dashboards into their own product — providing customers with branded, customisable data interfaces powered by Polymer’s AI without building the analytics layer from scratch. API access starts at $500/month.

How does Polymer differ from Tableau?

Polymer is designed for non-technical users who want AI to generate dashboards from spreadsheet data immediately — no configuration, no SQL, no training required. Tableau is designed for data analysts who need complex modelling, enterprise governance, and multi-source SQL queries. Polymer is better for making data accessible to business teams. Tableau for enterprise data analysis infrastructure.

What data formats does Polymer accept?

Polymer accepts CSV uploads, Google Sheets connections, and data sources via API integration — covering the most common formats that business teams work with for reporting and analysis.

Final Recommendation

Polymer is the most accessible AI data analysis platform for business teams whose data lives in spreadsheets and whose analytical questions deserve better answers than manual pivot tables can provide. The automatic dashboard generation, natural language querying, and proactive AI insight surfacing create a data analysis experience that makes every team member capable of getting answers from their own data — without waiting for a data analyst or learning a BI tool. For SaaS companies who want to add customer-facing analytics to their product without months of engineering investment, the embedded API provides a particularly practical path.

Next steps

Feature your app on AI tools for free

Subscribe to our Newsletter

Stay up-to-date with the latest AI Apps and cutting-edge AI news.

Trending Categories