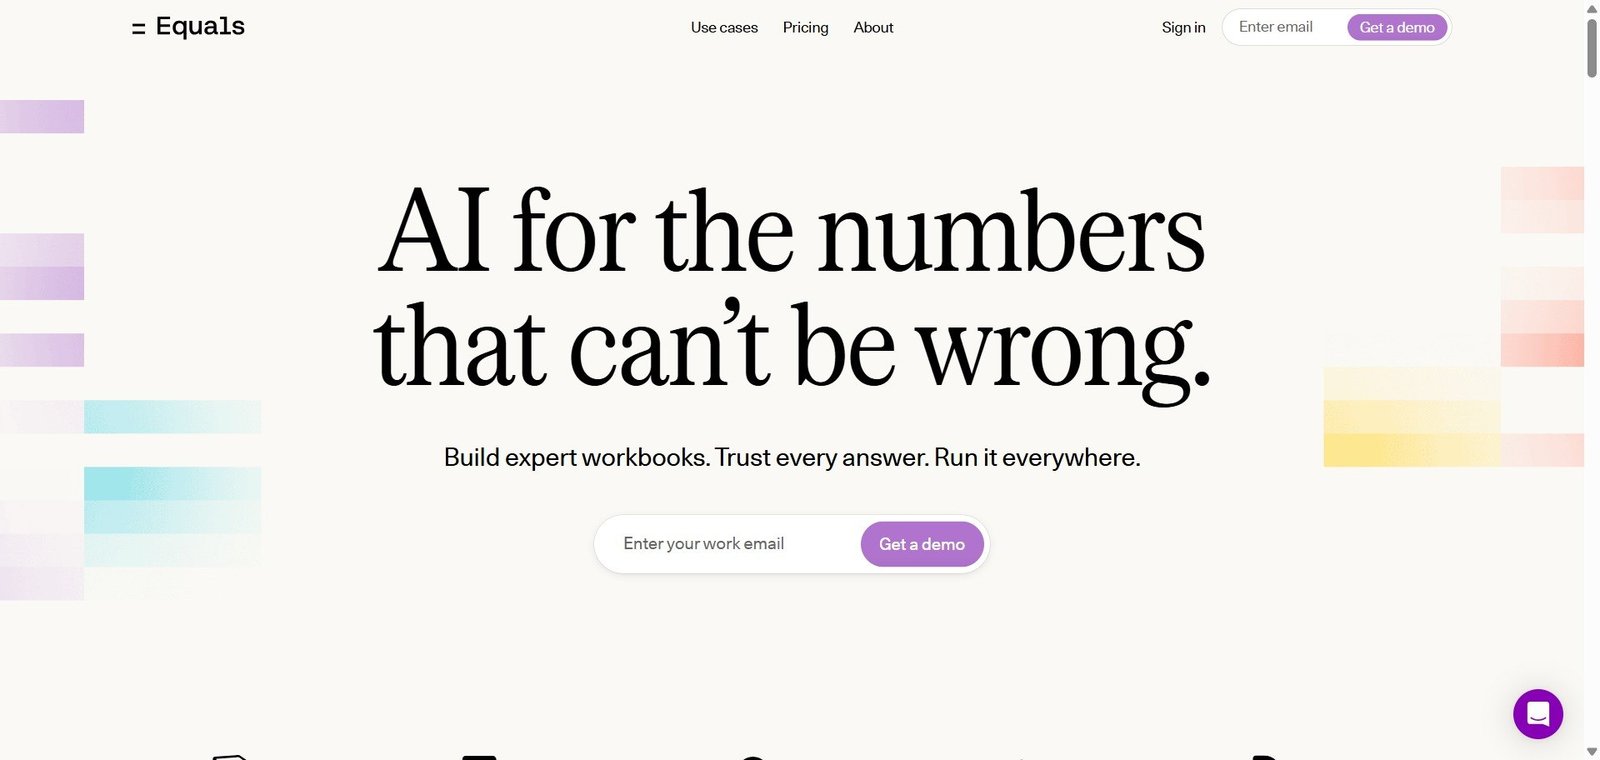

Equals
The spreadsheet that connects to your data warehouse — AI SQL, live data from Stripe and Salesforce, and board-ready reporting without the BI tool learning curve.
Equals Review: The AI BI Spreadsheet That Solves the Data Warehouse Access Problem for GTM and Finance Teams
Business intelligence tools have a usability ceiling — the most powerful BI platforms require data engineering support, SQL expertise, or weeks of learning before analysts can build the reports they actually need. Spreadsheets have the opposite problem — every operator knows how to use them, but they cannot stay connected to live data at scale. Equals was built to bridge this gap: a browser-based spreadsheet that looks and feels like Excel, connects directly to Snowflake, BigQuery, Redshift, Stripe, Salesforce, HubSpot, and other data sources, and uses AI to generate the SQL that pulls live data without requiring the analyst to write it from scratch. The result is warehouse-native business intelligence in the interface that GTM, Finance, and RevOps teams already know how to use.
Quick Summary
Equals is an AI-powered BI spreadsheet platform founded by former Intercom executives — connecting directly to data warehouses including Snowflake, BigQuery, and Redshift alongside SaaS sources including Stripe, Salesforce, HubSpot, Google Analytics, and PostgreSQL, with AI SQL generation in plain English, automated Slack and email report distribution, formula error detection, and SOC 2 Type II certification — with pricing from $24,000/year, used by Descript, Superhuman, Pylon, Notion, and Framer.
Is it worth using? Yes for RevOps, Finance, and Growth teams at Series A to growth-stage companies who want warehouse-native business intelligence in a spreadsheet interface with AI SQL assistance — without the BI tool implementation complexity or the data staleness of manual CSV exports.
Who should use it? Revenue operations leaders, finance analysts, growth teams, and founders at SaaS companies with data in Snowflake, BigQuery, or Stripe who want board-ready ARR dashboards, pipeline reports, and funnel analytics in a live, shareable spreadsheet without learning a new BI tool from scratch.
Who should avoid it? Individual analysts at very small companies whose data volumes and reporting needs are met by Google Sheets and manual CSV exports — Equals’ $24,000/year minimum investment requires meaningful data complexity and reporting frequency to justify.
Verdict Summary
Best for
- RevOps and Finance teams at Series A to Series C SaaS companies who need live ARR dashboards, pipeline cohorts, and revenue reporting from Stripe and Salesforce data without rebuilding in a BI tool every time the data model changes
- Growth teams at data-forward companies whose weekly reporting is currently managed through manual CSV exports, VLOOKUP-heavy spreadsheets, and the risk of stale data — Equals replaces the export-and-rebuild workflow with live connected analysis
- Founders and operators who want to answer data questions in a spreadsheet interface with AI SQL assistance — asking “show me net new ARR by cohort for the last six quarters” and having AI generate the query rather than writing it or waiting for a data team
Not for
- Companies whose data volume and complexity are still adequately served by Google Sheets with manual exports — Equals’ entry pricing at $24,000/year requires the right scale of data complexity to justify
- Enterprise analytics teams who need the full suite of data governance, row-level security, and enterprise administration that platforms like Looker or Tableau provide
- Teams whose primary need is interactive dashboards for non-technical business stakeholders rather than analyst-grade spreadsheet analysis
Rating
⭐⭐⭐⭐ 4.2 / 5
What Is Equals?
Equals was founded by former Intercom executives who experienced the exact problem the product solves — RevOps and Finance teams perpetually rebuilding spreadsheet reports from manual data exports because their spreadsheets could not stay connected to the underlying data sources. The platform positions itself as the “system of record” for GTM analytics — the live, authoritative source for ARR, pipeline, and funnel data that teams share in board meetings, investor updates, and weekly reviews without worrying whether the numbers are current.
Its philosophy — “the spreadsheet is the best UI for analysis” — reflects a deliberate choice to make warehouse-native data analysis accessible in the interface operators already trust rather than requiring them to learn a new BI paradigm. The AI layer generates, edits, and explains SQL from plain English prompts, making live data access available to analysts who know the business questions they want to answer but not always the SQL to get there.
How Equals Works
- Connect your data sources. Connect Equals to your data warehouse — Snowflake, BigQuery, Redshift, or SQL Server — alongside SaaS connectors for Stripe, Salesforce, HubSpot, Google Analytics, QuickBooks, Plaid, PostgreSQL, and MySQL. Live data flows into the spreadsheet without manual export.
- Work in a familiar spreadsheet. Equals looks and operates like a spreadsheet — cells, formulas, charts, and tabs work as expected. The learning curve is minimal for anyone who can use Excel or Google Sheets.
- AI generates SQL from plain English. Ask Equals’ AI for data — “show me MRR by customer cohort for the last 12 months” or “which sales reps had the highest close rates last quarter?” — and the AI generates the SQL query, runs it against the connected data source, and returns the result in a spreadsheet table.
- Build live dashboards and reports. Combine live data queries with spreadsheet formulas, charts, and layouts to build ARR dashboards, pipeline reports, and funnel analyses that stay current as the underlying data changes without requiring manual refresh.
- Automate report distribution. Schedule automated Slack messages and emails that push updated reports to relevant stakeholders — weekly pipeline reports to the sales team, monthly ARR updates to investors — without anyone needing to manually export and send.
- Collaborate with version control. Teams collaborate in shared workbooks with version control, access permissions, and role-based access — maintaining a single source of truth for key metrics rather than multiple spreadsheet versions floating across the organisation.
Key Features
- Warehouse-native connectivity — connects directly to Snowflake, BigQuery, Redshift, and SQL Server for live data analysis
- SaaS connectors for Stripe, Salesforce, HubSpot, Google Analytics, QuickBooks, Plaid, PostgreSQL, and MySQL
- AI SQL generation, editing, and explanation from plain English prompts — no SQL knowledge required for data access
- AI formula error detection and instant fix suggestions
- AI-automated chart and visualisation suggestions from spreadsheet data
- Familiar spreadsheet interface — no new BI paradigm to learn for Excel and Google Sheets users
- Automated Slack and email report distribution on configurable schedules
- Version control, access controls, and collaborative workbooks for team analytics
- SOC 2 Type II certified — enterprise data security
- Pre-built ARR dashboards, cohort analysis, and sales reporting templates for SaaS teams
- Used by Descript, Superhuman, Pylon, Notion, and Framer
- Pricing from $24,000/year — tailored trial period available before commitment
Real-World Use Cases
- Board-ready ARR reporting: A RevOps leader at a Series B SaaS company uses Equals to build a live ARR dashboard connected to Stripe and Salesforce — net new ARR, expansion, contraction, and churn calculate automatically from live data. The quarterly board deck pulls numbers directly from Equals rather than manually copying from three separate spreadsheets, eliminating the pre-board data reconciliation that previously consumed two days per quarter.
- AI SQL for business questions: A finance analyst without SQL expertise needs to know which customer cohorts from the past two years have the highest net revenue retention. They ask Equals’ AI “show me NRR by acquisition cohort for the last 8 quarters” — the AI generates and runs the query against the connected data warehouse, returning the cohort analysis in a spreadsheet table in under 30 seconds without involving the data team.
- Pipeline reporting automation: A Head of Revenue uses Equals to build a weekly pipeline report connected to Salesforce — new opportunities, stage changes, and forecast movements update automatically each Monday morning. Equals sends the completed report to the sales leadership Slack channel automatically at 8am without any manual export or formatting.
- Growth analytics without a BI tool: A growth team at a 50-person startup needs funnel analytics from their product database — activation rates, feature adoption, and retention cohorts. Rather than waiting weeks for a BI tool implementation, they connect Equals to their PostgreSQL database, use AI SQL to build the queries they need, and have live funnel dashboards running in a day.
Pros and Cons
| Pros | Cons |
|---|---|
| Warehouse-native live data in a familiar spreadsheet interface — eliminates the manual export workflow that makes spreadsheet reporting perpetually stale | Entry pricing at $24,000/year requires meaningful data complexity and reporting frequency to justify for smaller teams |
| AI SQL generation makes warehouse data accessible to analysts who know the business questions but not the SQL | Not a full BI platform — enterprise data governance, row-level security, and advanced user management require supplemental tooling |
| Automated Slack and email report distribution eliminates manual reporting overhead for recurring reports | Limited to approximately 10 data source integrations — broader connector coverage requires additional data pipeline tooling |
| Pre-built SaaS metric templates for ARR, pipeline, and funnel reduce the time to first board-ready dashboard | Still evolving — some users note occasional feature limitations and a product roadmap that is actively catching up to the full vision |
| SOC 2 Type II certified with data encrypted at rest — enterprise security at startup-scale pricing | Custom pricing requires sales engagement before trial access — no instant self-serve evaluation |
Pricing & Plans
Equals pricing starts at $24,000/year — described on the pricing page as “trusted AI analytics, from $24k/year.” All plans are custom-quoted through a sales conversation, with a tailored trial period offered before any commitment. Contact equals.com to discuss pricing based on team size and data sources.
Best Alternatives & Comparisons
- Coefficient — Better for Google Sheets and Excel teams wanting live CRM and database sync at lower entry pricing without warehouse-native connectivity
- Rows AI — Better for teams wanting an AI-first spreadsheet with API and database connections at more accessible pricing
- Looker — Better for enterprise BI with full data governance, row-level security, and embedded analytics — higher complexity and investment
- Julius AI — Better for conversational data analysis on uploaded files without live warehouse connectivity
Frequently Asked Questions (FAQ)
Equals is an AI-powered BI spreadsheet platform that connects directly to Snowflake, BigQuery, Stripe, Salesforce, and HubSpot — providing live warehouse data in a familiar spreadsheet interface with AI SQL generation, automated reporting, and board-ready SaaS metric dashboards for RevOps, Finance, and Growth teams.
Equals pricing starts at $24,000/year. All plans are custom-quoted through a sales conversation. A tailored trial period is available before commitment.
No — Equals’ AI generates, edits, and explains SQL queries from plain English prompts. Analysts can access warehouse data by describing the question they want to answer rather than writing the SQL themselves. Data analysts who do know SQL can write and customise queries directly for more complex analysis.
Equals connects to Snowflake, BigQuery, Redshift, and SQL Server data warehouses alongside SaaS sources including Stripe, Salesforce, HubSpot, Google Analytics, QuickBooks, Plaid, PostgreSQL, and MySQL — covering the core data sources for most SaaS GTM and Finance analytics.
Equals connects directly to live data sources — when the underlying data in Snowflake, Stripe, or Salesforce changes, the connected Equals spreadsheet reflects those changes without requiring manual export and import. Automated report distribution then sends updated reports on configurable schedules.
Equals provides warehouse-native live data in a familiar spreadsheet interface with AI SQL assistance — accessible to any analyst who can use Excel, with faster time-to-first-insight and lower implementation complexity. Looker provides full enterprise BI with data modelling, row-level security, embedded analytics, and comprehensive governance — requiring data engineering investment and longer implementation. Equals for RevOps and Finance teams who want warehouse data in a spreadsheet. Looker for enterprise data teams who need the full BI governance stack.
Final Recommendation
Equals is the most practical solution for the specific and widespread problem of RevOps and Finance teams building important business reports on manually exported, perpetually stale spreadsheet data. The warehouse-native live connectivity, AI SQL generation, familiar spreadsheet interface, and automated distribution solve the full lifecycle of the reporting problem — from data access through analysis to delivery — without requiring BI tool expertise or data engineering support. For any operator whose Monday morning starts with downloading a CSV from Salesforce to update a spreadsheet that should have been live all along, Equals replaces that workflow permanently.
Next steps