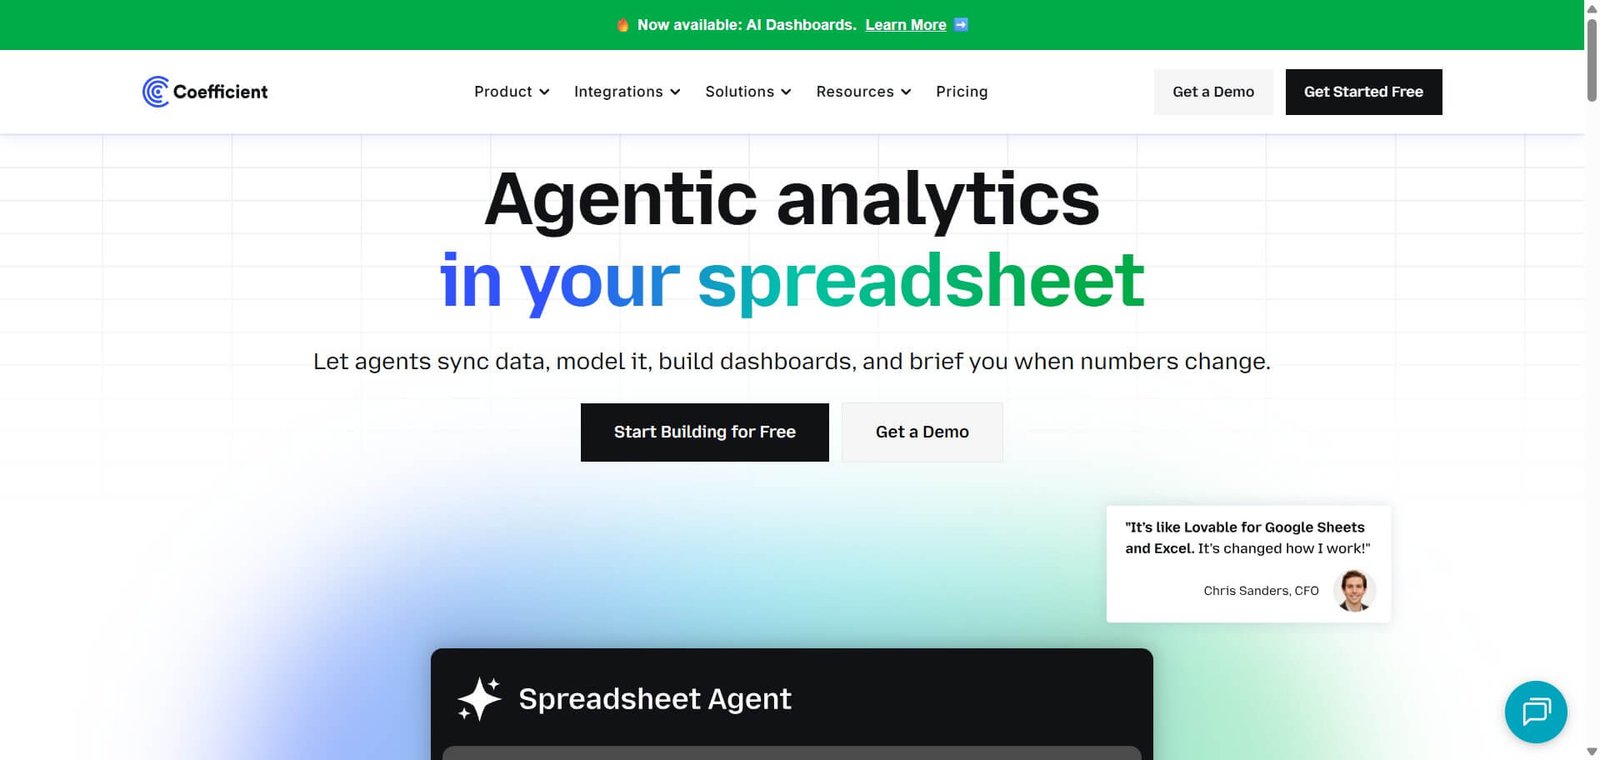
Live data from Salesforce, HubSpot, and 100 plus sources, synced directly into Google Sheets — with AI that answers your data questions inside the spreadsheet.
Coefficient Review: The Spreadsheet Tool That Finally Solves the Live Data Problem for Revenue and Finance Teams
Every revenue operations, finance, and sales team has the same spreadsheet problem — the data in their reports is always out of date. Pulling fresh Salesforce data into a spreadsheet means manual export, formatting, and rebuild. By the time the report reaches the meeting, it reflects last week’s numbers. Coefficient solves this by turning Google Sheets and Excel into live data dashboards — syncing directly from Salesforce, HubSpot, Snowflake, NetSuite, and 100 plus other sources with automatic scheduled refreshes, so the spreadsheet always shows current data without anyone manually pulling an export.
Quick Summary
Coefficient is a no-code data automation platform that lives as an add-in for Google Sheets and Excel — syncing live data from 100 plus business systems including Salesforce, HubSpot, Snowflake, and NetSuite, scheduling automatic data refreshes, setting alerts for data changes, and providing an AI Analyst that answers data questions and generates formulas within the spreadsheet.
Is it worth using? Yes for revenue operations, sales, finance, and marketing teams who build regular reports in Google Sheets or Excel from CRM and database sources and want live data without manual exports. Who should use it? RevOps managers, sales operations analysts, finance teams, and marketing operations professionals who build recurring reports in Google Sheets or Excel from systems like Salesforce, HubSpot, and Snowflake. Who should avoid it? Teams who need complex ETL pipelines, data warehouse transformations, or full BI platform features — Stitch, dbt, or Looker serve these needs better.
Verdict Summary
Best for
Revenue operations and sales operations teams who build weekly pipeline reports, quota tracking, and forecast dashboards in Google Sheets from Salesforce data — Coefficient eliminates the Monday-morning export ritual that consumes hours each week
Finance teams who pull NetSuite or QuickBooks data into spreadsheets for monthly reporting — live sync and automated refresh replace the manual extract-format-distribute cycle that delays financial reporting
Marketing operations teams managing campaign performance reporting across HubSpot, Google Analytics, and ad platforms in Google Sheets — one Coefficient setup keeps all sources current without weekly manual data pulls
Not for
Data engineers who need complex multi-source ETL transformations before loading to a warehouse
Teams whose reporting needs are complex enough to require a dedicated BI platform like Looker or Tableau
Very small teams whose data needs are simple enough that manual exports are not a meaningful time burden
Rating ⭐⭐⭐⭐ 4.3 / 5
What Is Coefficient?
Coefficient is a data automation platform delivered as a Google Sheets add-on and Excel add-in that connects spreadsheets to the live business systems teams use every day — CRM platforms, data warehouses, ERP systems, databases, and SaaS tools — enabling automatic data sync, scheduled refreshes, and AI-powered analysis without leaving the spreadsheet environment that revenue and finance teams already use.
Its core value is bridging the gap between where data lives — in Salesforce, HubSpot, Snowflake, or NetSuite — and where business teams work with it — in Google Sheets — without requiring engineering involvement, SQL knowledge, or manual export processes. Teams get live data in their familiar spreadsheet environment with automatic refreshes ensuring it stays current.
How Coefficient Works
Install the add-on. Add Coefficient to Google Sheets or Excel from the respective app marketplace. Installation takes under five minutes with no code required.
Connect data sources. Authenticate Salesforce, HubSpot, Snowflake, NetSuite, MySQL, PostgreSQL, or any of 100 plus supported sources — Coefficient uses read-only access to pull data without risk of modifying source systems.
Import data to the spreadsheet. Use Coefficient’s sidebar to select the object, fields, and filters for the data import — a Salesforce pipeline report, HubSpot contact list, or Snowflake query result. The data appears in the spreadsheet immediately.
Schedule automatic refreshes. Set the refresh frequency — hourly, daily, weekly — and Coefficient automatically updates the data on schedule without anyone needing to trigger the refresh manually.
Set alerts for data changes. Configure threshold alerts — notify when the pipeline drops below a specific value, when a deal closes, or when a KPI crosses a target — delivered via email or Slack without manual monitoring.
Use AI Analyst for questions and formulas. Ask the AI Analyst natural language questions about the data in the spreadsheet, or request formula generation for complex calculations — the AI works within the spreadsheet context rather than requiring export to a separate tool.
Key Features
Live data sync from 100 plus sources including Salesforce, HubSpot, Snowflake, NetSuite, MySQL, PostgreSQL, Google Analytics, and others
Automatic scheduled data refresh — hourly, daily, or weekly without manual triggering
Threshold alerts delivered via email or Slack when KPIs cross defined values
AI Analyst for natural language data questions and formula generation within the spreadsheet
No-code interface — all data operations performed through the sidebar without SQL or API knowledge
Google Sheets add-on and Excel add-in for the spreadsheet environment teams already use
Read-only source system access — no risk of modifying connected business systems
Bidirectional write-back to Salesforce and HubSpot from within the spreadsheet on paid plans
Pre-built report templates for common use cases — pipeline reports, marketing dashboards, finance summaries
SOC 2 compliance for enterprise data security requirements
Real-World Use Cases
Weekly pipeline review: A sales operations manager builds a live Salesforce pipeline dashboard in Google Sheets using Coefficient — the dashboard refreshes automatically each morning, showing current opportunity stage, value, and close date without a Monday-morning export ritual. The pipeline review meeting runs on data that is current as of that morning rather than last Friday.
Marketing campaign reporting: A marketing ops team connects HubSpot, Google Analytics, and LinkedIn Ads to one Coefficient-powered Google Sheet — all campaign performance data refreshes automatically on a daily schedule, eliminating three separate weekly manual export and paste operations that previously consumed half a day.
Financial close automation: A finance team uses Coefficient to pull NetSuite actuals into their month-end Google Sheets model — the live connection means the P&L model updates automatically as NetSuite data changes, reducing the manual data pulling step that was consuming two days of each month-end close.
Executive dashboard: A RevOps leader builds an executive dashboard in Google Sheets combining Salesforce pipeline, HubSpot marketing, and Snowflake product usage data — Coefficient keeps all three sources live, and the AI Analyst answers ad-hoc questions from the data without requiring a separate BI tool query.
Eliminates manual data export and paste workflows for teams running recurring reports from CRM and warehouse sources
Starter at $49/user/month is expensive for individual users with limited data needs
100 plus integrations cover the data sources that revenue and finance teams use without building custom connectors
Premium sources like Snowflake, Sage Intacct, and NetSuite require Pro plan or higher
Automatic scheduled refresh keeps spreadsheet data current without anyone triggering manual updates
Per-user pricing becomes significant as the number of reporting team members grows
AI Analyst works within the spreadsheet context — answering questions from live data without exporting to another tool
Not a BI platform — complex data transformations and advanced visualisation require dedicated tools
Bidirectional write-back to Salesforce and HubSpot enables data updates from the spreadsheet on paid plans
Interface can be overwhelming for new users — advanced integrations require initial setup time
Pricing & Plans
Free — $0
Limited data sources
Manual refresh only
Basic features
Community support
Starter — $49/user/month
3 data sources
500 refreshes per month
Scheduled refresh
Chat and email support
Pro — $99/user/month
6 data sources
5,000 refreshes per month
Unlimited rows
AI Analyst
Bidirectional write-back
Priority support
Enterprise — Custom pricing
Unlimited data sources
Custom refresh volume
SSO and compliance
Dedicated support
Best Alternatives & Comparisons
Julius AI — Better for conversational data analysis on uploaded files without live CRM sync
Polymer — Better for automatic dashboard generation from uploaded spreadsheets without live data sync
Supermetrics — Better for marketing data specifically with deeper ad platform and analytics integrations
Rows AI — Better for an all-in-one spreadsheet with built-in data sources and AI, less deep CRM integration
Frequently Asked Questions (FAQ)
What is Coefficient?
Coefficient is a no-code data automation platform delivered as a Google Sheets add-on and Excel add-in — syncing live data from Salesforce, HubSpot, Snowflake, NetSuite, and 100 plus other sources with automatic scheduled refreshes and an AI Analyst for data questions.
Is Coefficient free?
Yes — Coefficient offers a free plan with limited data sources and manual refresh. The Starter plan at $49/user/month provides 3 data sources with automated scheduled refresh.
Does Coefficient modify connected data sources?
No — Coefficient uses read-only access to connected systems for data import. Bidirectional write-back to Salesforce and HubSpot is available on Pro plans, but standard imports are read-only.
What data sources does Coefficient support?
Coefficient supports 100 plus integrations including Salesforce, HubSpot, Snowflake, NetSuite, QuickBooks, MySQL, PostgreSQL, Google Analytics, LinkedIn Ads, and other common business systems.
How does Coefficient's automatic refresh work?
Coefficient allows setting a refresh schedule — hourly, daily, or weekly — for each data import. At the scheduled time, Coefficient automatically pulls fresh data from the source system and updates the spreadsheet without manual triggering.
How does Coefficient compare to Supermetrics?
Coefficient supports broader business data sources — CRM, ERP, and databases alongside marketing platforms. Supermetrics specialises in marketing analytics sources — ad platforms, Google Analytics, and social media. Coefficient for revenue operations, sales operations, and finance teams. Supermetrics for marketing data specifically.
Final Recommendation
Coefficient is the most practical data automation tool for revenue operations, sales operations, and finance teams who build recurring reports in Google Sheets from CRM and database sources and are tired of the manual export cycle that makes their reports perpetually out of date. The live data sync, automatic refresh scheduling, and AI Analyst create a spreadsheet workflow where the data is always current and questions can be answered without leaving the environment the team works in. For any operations or finance team spending hours each week on manual data exports before building reports, Coefficient converts that time into the one-time cost of building a connected report that refreshes automatically forever.