Amplitude Review: The Digital Analytics Platform That Connects Product Data to Business Outcomes
Most analytics platforms tell you what users did. Amplitude tells you what happened to the business as a result. Its focus on connecting user behaviour data to revenue metrics, retention outcomes, and growth KPIs makes it the platform of choice for product-led growth companies where every feature decision, experiment, and user flow change needs to be evaluated against its downstream impact on the metrics that determine business outcomes.
Quick Summary
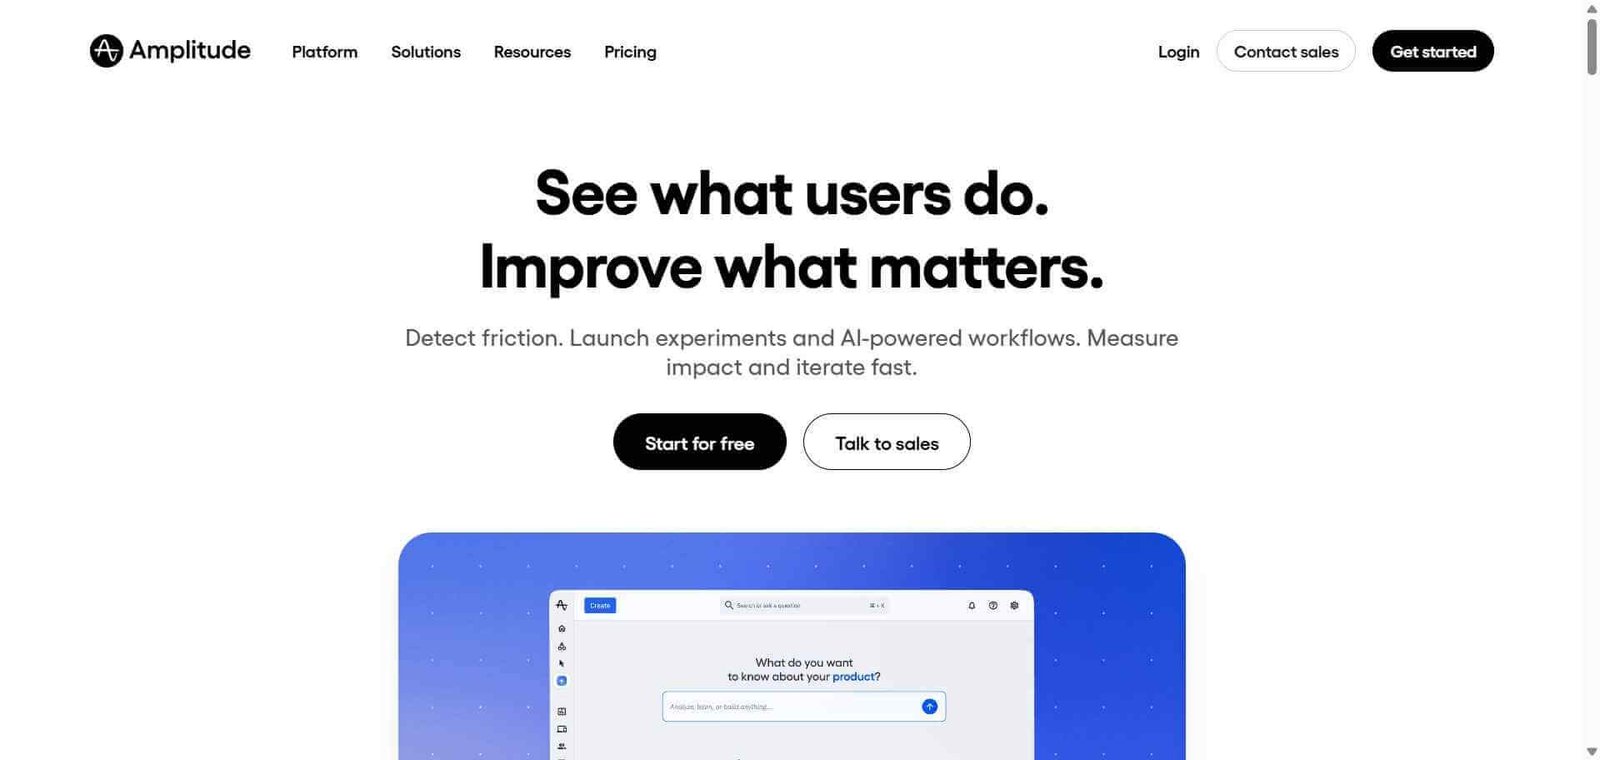
Amplitude is an AI-powered digital analytics platform covering event tracking, funnel and retention analysis, predictive analytics, and experiment measurement, with AI-powered insights that connect user behaviour to business outcomes for product-led growth teams.
Is it worth using? Yes for growth-focused product teams who need to understand not just what users do but what those actions mean for retention, revenue, and long-term business outcomes. Who should use it? Product managers, growth teams, data analysts, and executives at product-led companies who need to connect product behaviour data to business metrics and make data-driven growth decisions. Who should avoid it? Teams whose analytics needs are met by simpler event tracking, or companies without the data maturity to benefit from Amplitude’s more sophisticated analysis capabilities.
Verdict Summary
Best for
Product-led growth companies who need to connect feature usage data to retention, expansion revenue, and churn outcomes
Growth teams measuring experiment results and understanding the downstream business impact of product changes
Executive and leadership teams who need product analytics connected to business KPIs in dashboards they can review independently
Not for
Early-stage teams without sufficient event data volume to benefit from predictive analytics features
Teams whose primary need is behaviour visualisation rather than quantitative event analysis
Companies without data engineering resources for proper implementation and maintenance
Rating ⭐⭐⭐⭐½ 4.6 / 5
What Is Amplitude?
Amplitude is a digital analytics platform that sits at the intersection of product analytics and business intelligence. Like Mixpanel, it tracks user events and provides funnel, retention, and segmentation analysis. Its differentiation lies in the sophistication of its analytical capabilities — particularly its Compass feature for identifying the actions that most predict retention, its revenue analytics connecting behavioural data to subscription and expansion revenue, and its experiment management for rigorous A/B testing measurement.
Amplitude AI adds Ask Amplitude for natural language data queries, automated insight generation that proactively surfaces significant changes in key metrics, and AI-powered anomaly detection that alerts teams when behaviour departs from expected patterns.
How Amplitude Works
Implement event tracking. Use Amplitude’s SDK to track user actions across your web and mobile product, defining events and their properties to build a complete picture of user behaviour.
Build your key analyses. Create funnel charts for conversion flows, retention charts for cohort return behaviour, and user segmentation analyses to understand how different user groups behave differently.
Use Compass for retention drivers. Run Amplitude’s Compass analysis to identify which early user actions most predict long-term retention, informing which onboarding steps to prioritise.
Connect to revenue data. Link behavioural data to subscription and expansion revenue, understanding which product paths lead to higher lifetime value and lower churn.
Measure experiments. Define experiment variants in Amplitude and measure their impact on every metric in your system, understanding second and third-order effects of product changes beyond the primary conversion metric.
Ask Amplitude AI. Use natural language questions to query your data and receive instant chart responses, reducing the time to insight for both analysts and non-technical stakeholders.
Key Features
Event-based tracking across web and mobile with SDKs for every major platform
Funnel, retention, and user segmentation analyses
Compass for identifying retention-predictive actions in early user journeys
Revenue analytics connecting behavioural data to subscription metrics
Experiment management for A/B test design and multi-metric measurement
Ask Amplitude for natural language data querying
Proactive AI insights surfacing significant metric changes automatically
Data warehouse sync for connecting Amplitude to BigQuery, Snowflake, and Redshift
Collaboration features for sharing analyses and dashboards across teams
Real-World Use Cases
Retention driver identification: A SaaS company runs Compass analysis on new user behaviour and identifies that users who invite a teammate within the first week retain at 4x the rate of those who do not, making team invitation the top onboarding priority.
Revenue impact analysis: A product team measures not just conversion rate but average contract value and 12-month retention for users who go through an updated onboarding flow versus the control, understanding the full downstream revenue impact.
Experiment significance measurement: A growth team runs an A/B test on a paywall design and uses Amplitude to measure impact across trial conversion, paid conversion, and 90-day retention simultaneously.
Proactive anomaly detection: Amplitude AI alerts the product team when a key event’s completion rate drops significantly, enabling rapid investigation before the issue affects a larger percentage of users.
Core analytics — funnels, retention, user sessions
2 years data retention
Plus — $61/month
1,000 monthly tracked users (scales by volume)
Advanced analyses
Experiment measurement
Slack integration
Priority support
Growth — Custom pricing
Custom tracked user volume
Revenue analytics
Data warehouse sync
Advanced permissions
Enterprise — Custom pricing
Unlimited scale
SSO and advanced security
Custom data retention
Dedicated support
Best Alternatives & Comparisons
Mixpanel — Very similar product analytics platform, both are strong choices for event-based product analytics
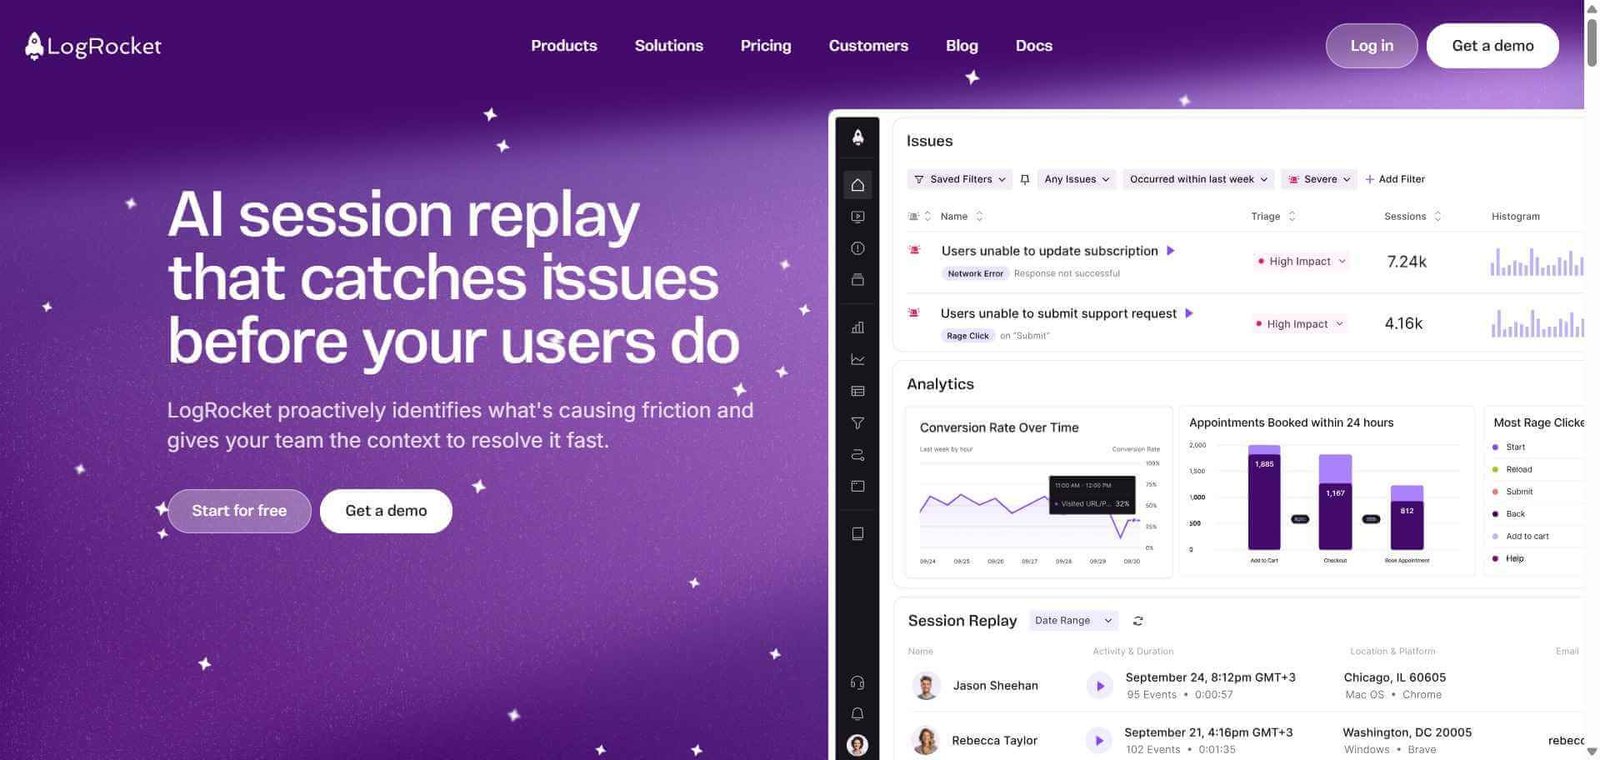
PostHog — Open-source alternative with similar event analytics plus session recording and feature flags
Hotjar — Complementary qualitative tool, not a replacement for quantitative event analytics
Pendo — Better for in-app guidance alongside analytics, different primary use case
Frequently Asked Questions (FAQ)
What is Amplitude?
Amplitude is an AI-powered digital analytics platform for tracking user events, analysing funnels and retention, measuring experiment impact, and connecting product behaviour to business outcomes for product-led growth teams.
Is Amplitude free?
Yes, Amplitude offers a free plan for up to 50,000 monthly tracked users with unlimited events and core analytics. Paid plans start at $61/month for advanced features.
What is Compass in Amplitude?
Compass is an Amplitude analysis that automatically identifies which early user actions most predict long-term retention, helping product teams understand which onboarding steps and features drive users to become loyal, long-term customers.
How does Amplitude compare to Mixpanel?
Both are strong event-based product analytics platforms. Amplitude tends to be stronger on retention driver analysis, revenue analytics, and experiment management. Mixpanel tends to have a cleaner interface and slightly lower entry pricing. Many teams evaluate both and the choice often comes down to interface preference.
What is Ask Amplitude?
Ask Amplitude is the AI-powered natural language query feature that allows anyone — including non-technical stakeholders — to ask data questions in plain English and receive an automatically generated chart answering the question, without needing to manually configure the analysis.
Can Amplitude sync with data warehouses?
Yes, Amplitude supports bidirectional data warehouse sync with BigQuery, Snowflake, and Redshift, allowing teams to use Amplitude alongside their existing data infrastructure rather than treating it as a silo.
Final Recommendation
Amplitude is the strongest choice for product-led growth companies that need to move beyond feature usage metrics into understanding the downstream business impact of every product decision. The Compass retention driver analysis, revenue analytics, and multi-metric experiment measurement provide a level of analytical sophistication that most event tracking tools do not offer. The generous free plan makes it accessible for teams evaluating whether their event data volume and analytical maturity justify the investment in Amplitude’s advanced features.